

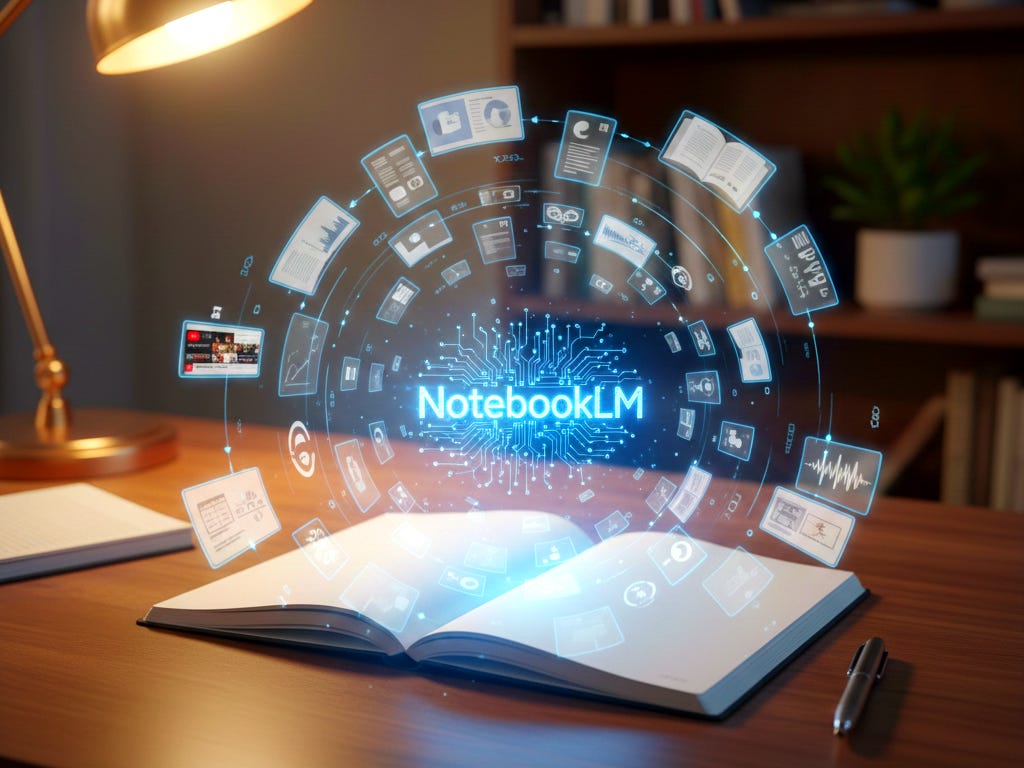
NotebookLM 2026, The Ultimate Guide of the Newest Features
How NotebookLM's newest tools turn research into professional training content

TL;DR: NotebookLM's 2026 features transform it from a document reader into a complete research-to-content pipeline. Five capabilities define the upgrade: source-controlled Deep Research (where you specify exactly which sources AI can use), automatic infographic generation, one-click slide deck creation, interactive audio overviews you can interrupt with questions, and a combined workflow that turns weeks of manual research into hours of verified, citation-backed output.
I interrupted an AI podcast mid-sentence and asked it a question.
The two hosts stopped their discussion about natural disasters, answered my specific question using verified UN data, then resumed their conversation (VIDEO BELOW). I was listening while walking on a treadmill.
That’s when I realized, this is another huge step forward in human-AI interaction and would open new doors for me, not because I suddenly had more time, but because comprehensive research no longer requires comprehensive time.
Every leader I know is drowning in the same paradox: We need better information to make better decisions, but getting better information takes time we don’t have for the decisions we need to make today.
In the past, I’ve had to skip the research that would have helped me make much more informed business decisions, not because I didn’t care, but because I didn’t have three weeks to read 40 reports.
The in-depth SWOT analysis would have revealed our positioning gap. The competitive landscape study that went beyond 5 companies would have shown me a pricing mistake I was about to make.
All of it skipped.
Fastforward to October… when I co-founded COZORA (a live learning platform for AI creators), I finally did the research I always skipped. The comprehensive competitor analysis across 12 platforms. The thorough market positioning research reviewing 47 publications. The detailed feature comparison examining 8 similar tools.
Not because I suddenly became more disciplined, but because NotebookLM’s 2026 features made thoroughness possible within the time I actually had.
Shameless COZORA plug… during December, all my Subscribers get 30% off with code HOLIDAY30 ($216 off)
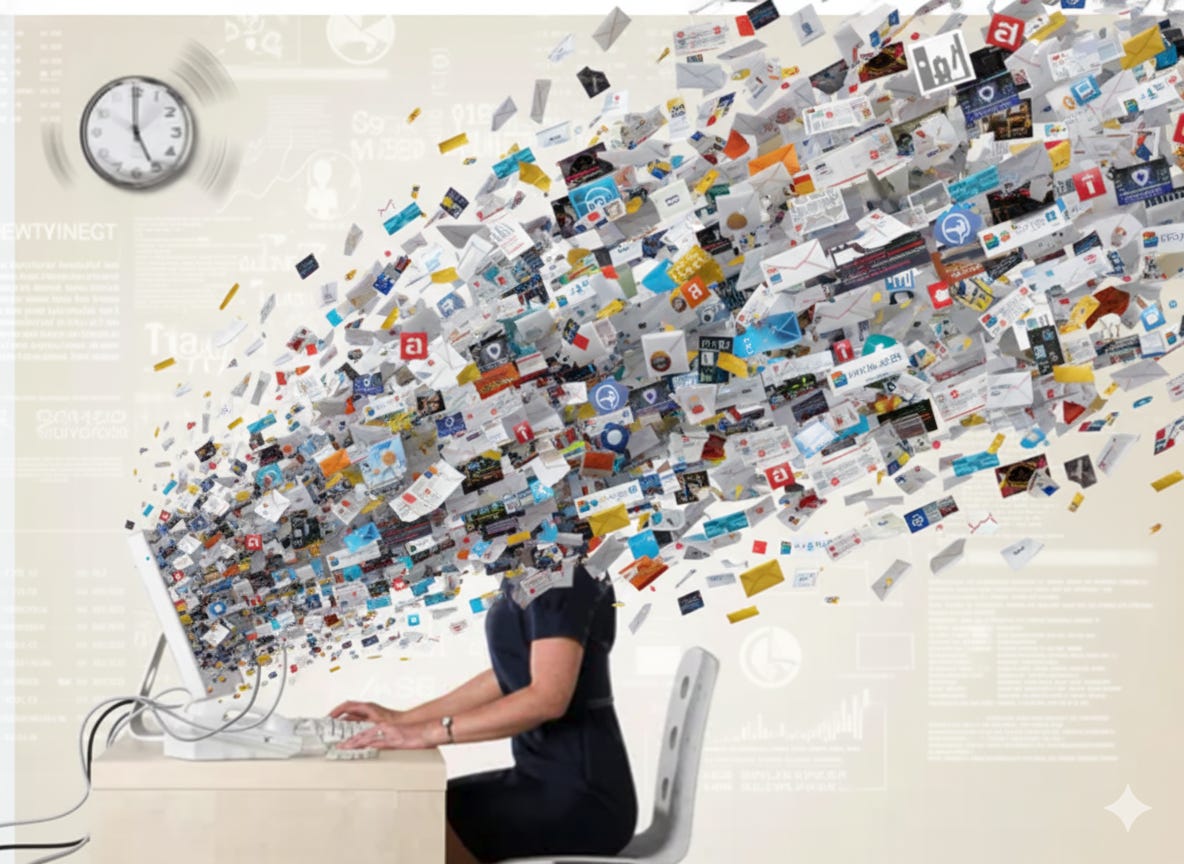
We’re drowning in the most information-rich era in human history. You absorb more data before breakfast than someone in the 15th century encountered in an entire year. But access to everything often feels like access to nothing.
We make decisions with 30% of the information we need because getting 100% would take 300% of the time we have.
What NotebookLM did was make comprehensive research possible within real-time constraints, not theoretical ones.
In this post, you’ll learn:
How to convert research into presentation slides in minutes without design skills
Why source control makes NotebookLM research more trustworthy than ChatGPT responses
My process for turning dense humanitarian data into engaging visual content
The feature that transforms research into audio learning experiences during commute time
A complete system for building professional training materials from scratch
Let’s start!
1. SOURCE CONTROL: Why I Trust NotebookLM Research More Than ChatGPT
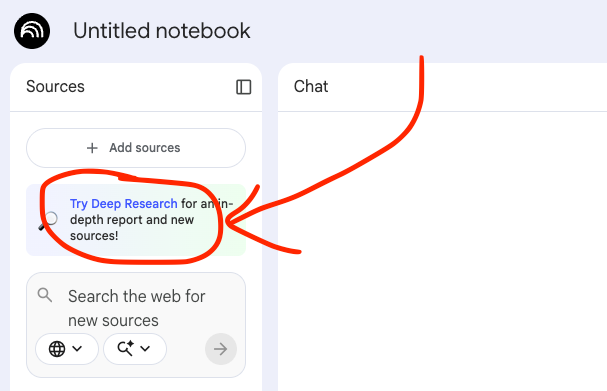
The first feature that transformed my research process was Deep Research integration, but not for the reason most people think.
Yes, it automates research. Yes, it saves time. But the actual game-changer is this:
You control which sources the AI uses.
Think about what happens when you ask ChatGPT or any general AI tool to research something. You get an answer. It sounds confident. It cites sources. But you have no idea if those sources are reliable, current, or even relevant to your specific context.
In fact, this is where top LLMs get their info:
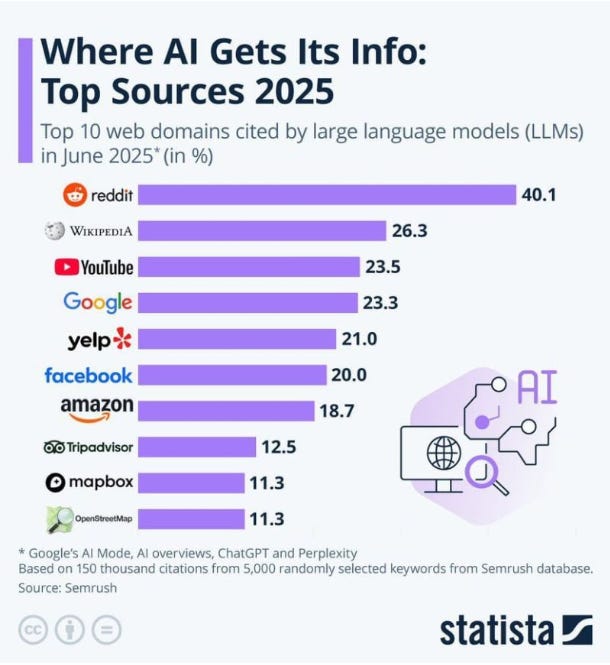
You’re trusting the AI to choose good sources. And that trust is often misplaced.
NotebookLM’s Deep Research flips this completely. You define which sources matter. You specify “only UN agencies, government reports, and peer-reviewed journals.” You exclude blog posts, opinion pieces, and unverified claims.
The AI then researches deeply within the boundaries you set.
This is the difference between polluted research and strategic research.
Case Study
I work in humanitarian aid at World Relief. When natural disasters increase in a region, we need accurate data to make resource allocation decisions. Lives depend on getting this right.
So when I needed to understand the surge in natural disasters across Africa in 2025, for example, I couldn’t rely on whatever sources ChatGPT happened to choose. I needed verified intelligence from organizations I trust.
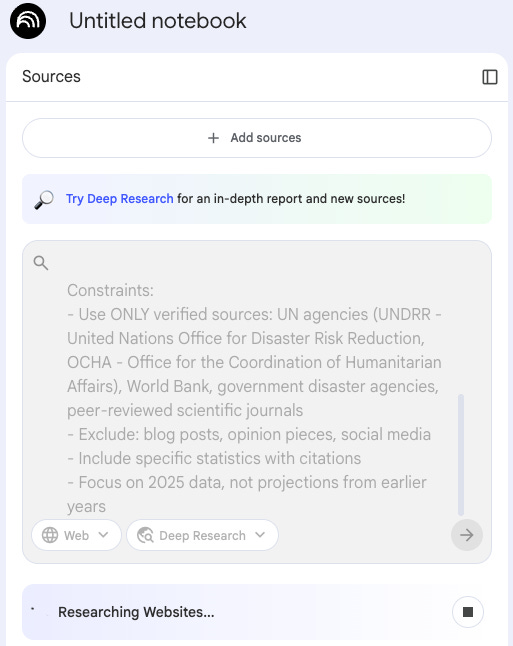
The exact prompt I used (notice how I got specific about constraints instead of hoping the AI would guess right):
Task:
Research the increase in natural disasters globally in 2025, with specific focus on Africa.

Context:
I need this research to inform resource allocation decisions for humanitarian organizations. Focus on:
- Types of disasters (floods, droughts, storms, wildfires)
- Geographic distribution and most affected regions
- Population impact and displacement numbers
- Economic costs and infrastructure damage
- Comparison to previous years (2023-2024)

Constraints:
- Use ONLY verified sources: UN agencies (UNDRR - United Nations Office for Disaster Risk Reduction, OCHA - Office for the Coordination of Humanitarian Affairs), World Bank, government disaster agencies, peer-reviewed scientific journals
- Exclude: blog posts, opinion pieces, social media
- Include specific statistics with citations
- Focus on 2025 data, not projections from earlier years
Notice the “Constraints” section. That’s where the power lives.
I’m not asking the AI to find “the best sources.” I’m telling it exactly which sources to trust and which to ignore.
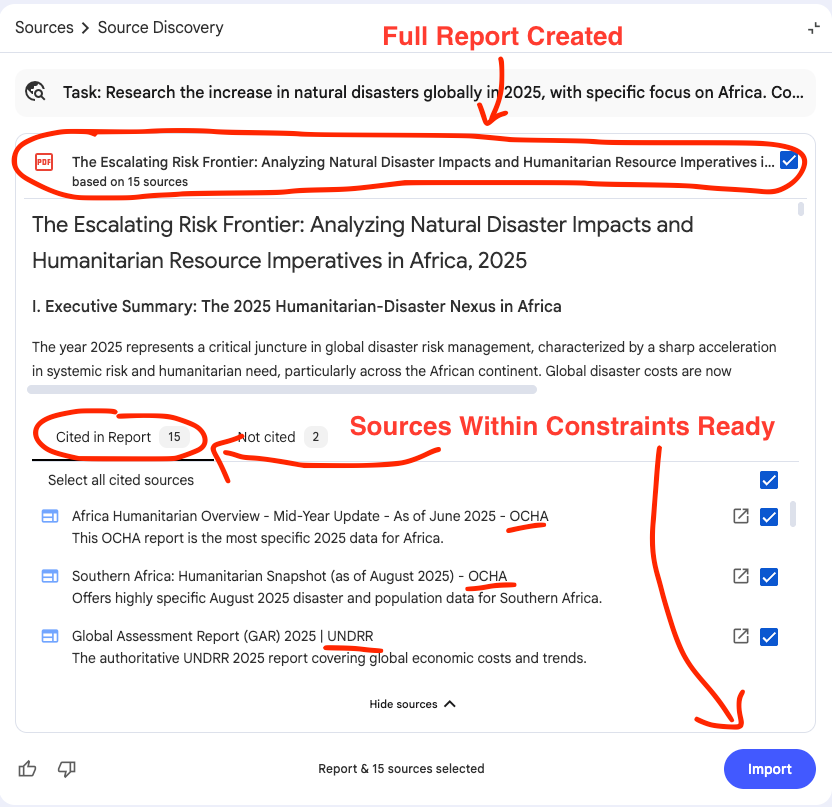
What I got back was a comprehensive 7-page report that would have taken me weeks to compile manually. More importantly, every single citation was from a source I would have used myself if I had the time.
The report included:
Verified statistics from UNDRR, World Bank, and national disaster agencies
Regional breakdowns WITH CITATIONS
Economic impact data WITH CITATIONS
Population displacement figures WITH CITATIONS
Comparative analysis WITH CITATIONS
But the critical part: I could immediately import this report and all its sources directly into my NotebookLM notebook.
This meant I could query the research, ask follow-up questions, and generate additional content, all grounded in sources I verified upfront.
For my Cozora launch research, source control was critical.
When researching the competitive landscape, I specified:
Only company websites and official documentation (not third-party reviews)
Only G2 and Capterra for user reviews (not random Reddit threads)
Only verified case studies with named companies (not anonymous testimonials)
When researching market sizing, I specified:
Only Gartner, Forrester, and McKinsey reports
Only government statistics for education and training markets
Only peer-reviewed research on online learning effectiveness
I wasn’t hoping the AI found good sources. I was guaranteeing it used the sources that mattered for my specific decision.
What would have been 2-3 weeks of manual research became 4 hours.
ChatGPT gives you confident answers from sources it chose. NotebookLM gives you confident answers from sources you trust. That’s not a feature difference. It’s a credibility difference.
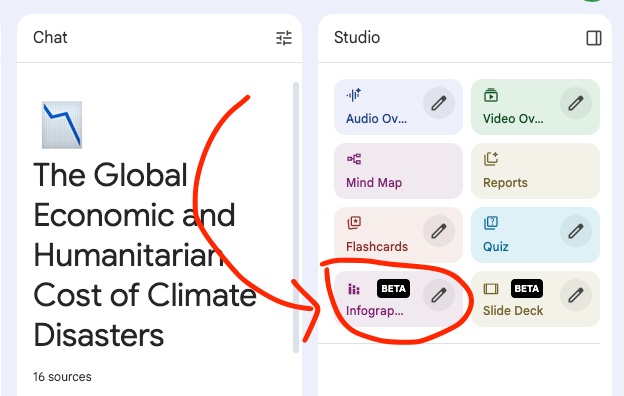
2. INFOGRAPHICS… Visual Content Without Design Skills
Now I had comprehensive research. But research sitting in a 7-page document doesn’t help my team understand the urgency or help donors visualize the impact.
I needed infographics. Professional ones. The kind that makes complex data instantly scannable.
Normally, this is where I’d either:
Spend 3-4 hours in Canva struggling with layouts (I’m not a designer)
Email our communications team and wait a week
Skip the visual entirely and hope people read paragraphs of statistics
NotebookLM’s infographic generator, powered by Nano Banana Pro (Google’s latest image generation model), changed this completely.
The feature converts your research content into professional-quality visual graphics. Not basic charts. Not amateur designs. Studio-quality infographics that look like you hired a designer.
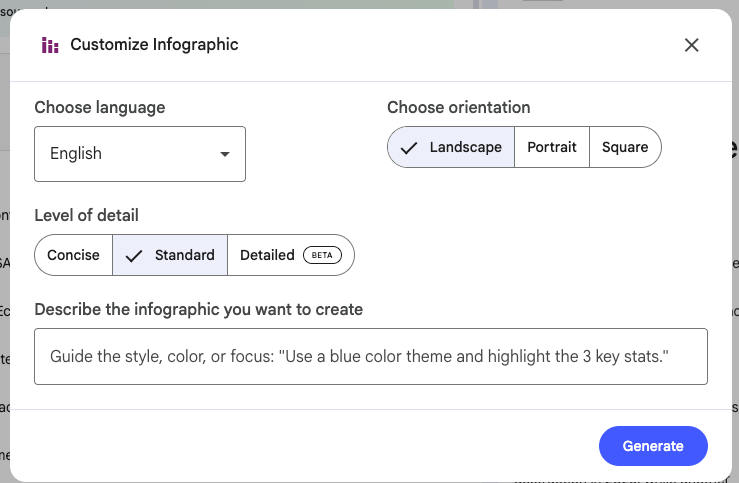
REMEMBER: Add your customization needs, brand colors, etc… Here were mine.
I selected the section of my Deep Research report focused on disaster statistics by type. Then I customized the infographic generation:
Orientation: Landscape (for presentations) Detail level: Detailed (I wanted comprehensive data visible) Custom description: “Create an infographic showing 2025 natural disaster impact in Africa. Use a map-based layout with statistics by disaster type (floods, droughts, storms, wildfires). Highlight the 40% increase in flood events in East Africa. Use earth tones and blues. Make the data immediately scannable for humanitarian decision-makers.”What NotebookLM generated:
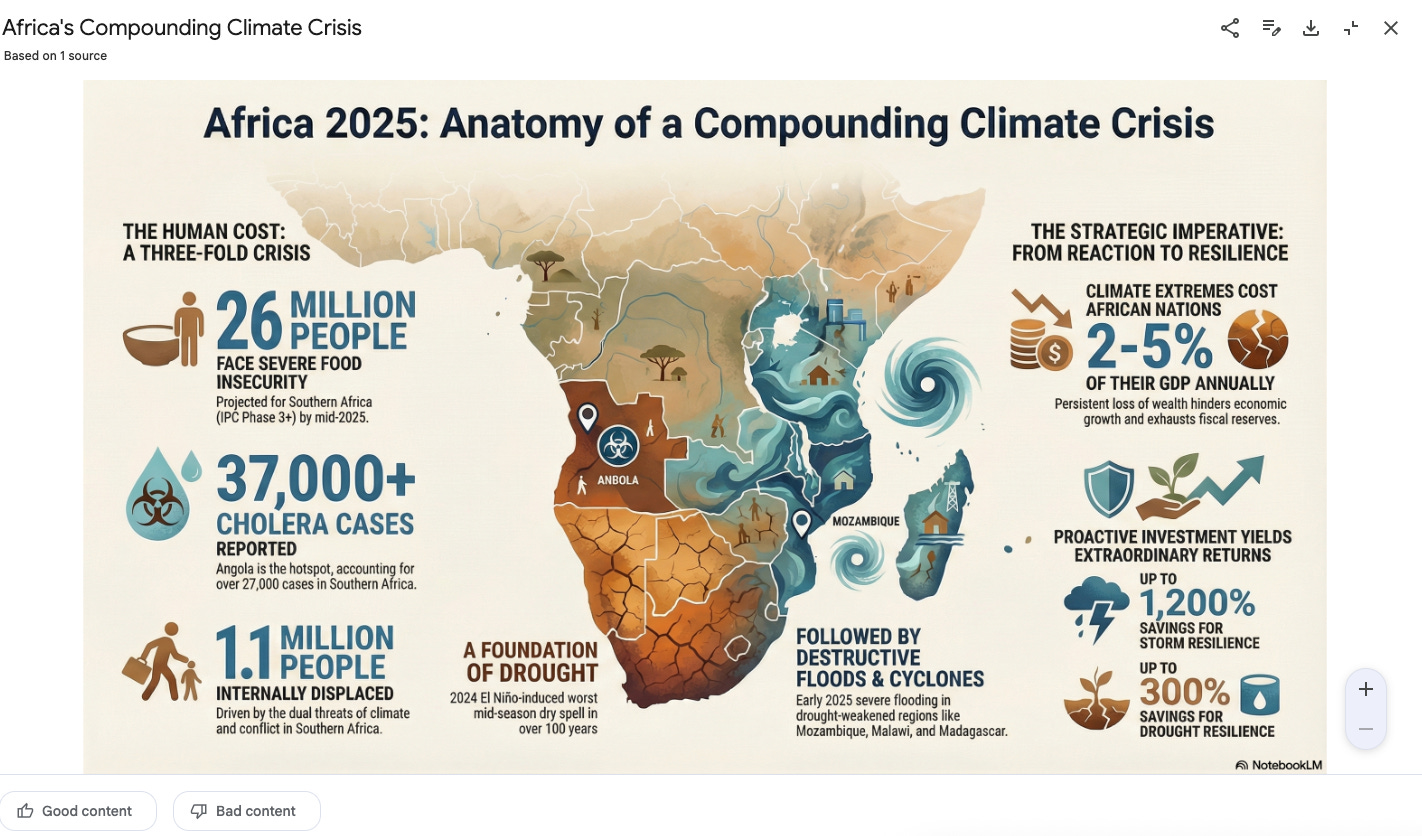
A professional infographic with:
Color-coded map of Africa showing disaster hotspots
Statistical callouts for each major disaster type
Clean typography and layout
I stared at my screen for a solid minute. This looked like something my team would pay a designer $500 to create. But I made it in 10 minutes by describing what I needed.
I literally said “wait, what?” out loud. My wife looked over from her laptop. “Did you make that?” No. I described what I wanted. NotebookLM made it.
Visual communication isn’t optional anymore. But most leaders don’t have design skills and don’t have time to learn. NotebookLM removes that barrier completely.
Brought to you by COZORA👇, learn AI live!
During December, All Subscribers get 30% with code HOLIDAY30
Premium subscribers get $360 off (50% per year) through the coupon in the Premium Hub.

3. SLIDES… From Research to Presentation
Now I have professional infographics. But I still faced the presentation problem every leader dreads: turning research into slides that don’t bore people to death.
Until now, I’ve been using GAMMA AI.
You’ve been there. You open PowerPoint. You stare at a blank slide. You wonder how to structure this. You spend an hour just organizing the flow, another hour formatting, another hour finding the right visuals.
Or you avoid making the presentation entirely. Just send the report and hope people read it (they won’t).
NotebookLM’s automatic slide deck feature eliminates all of that. I think the results will blow you away.
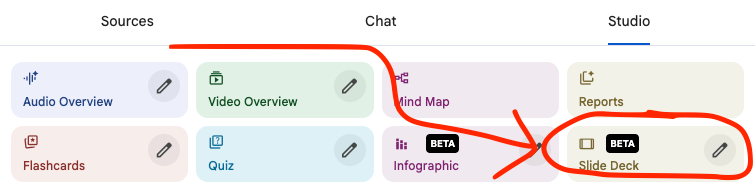
From my natural disaster research, I clicked one button in the Studio panel: “Create Slide Deck.”
NotebookLM asked me to choose between two formats:
Detailed deck: Comprehensive text and details, suitable for emailing or reading independently
Concise presenter slides: Clean visuals with key talking points to support a live presentation
I chose concise presenter slides because I needed them for a briefing. Then I added a simple customization detail: All Earth Tones.
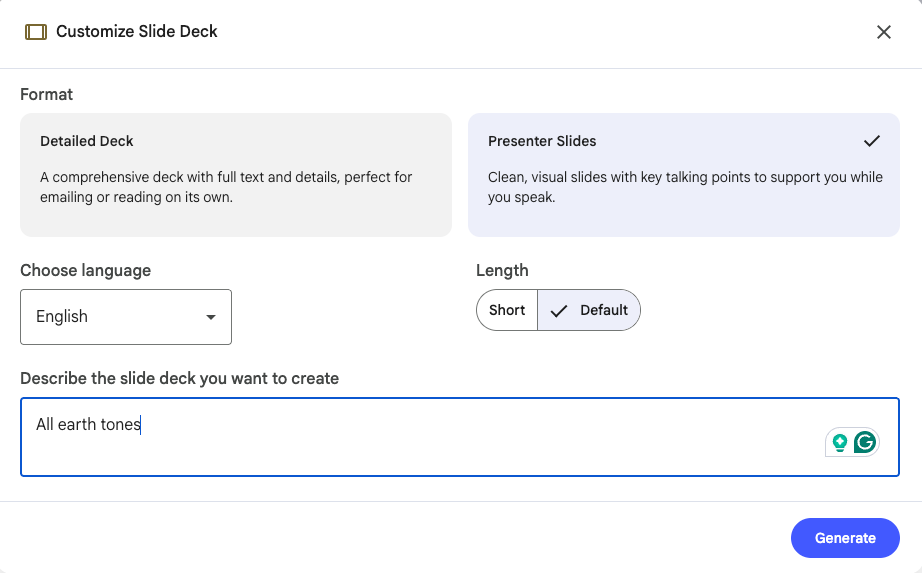
What NotebookLM generated:

A 14-slide presentation with:
Title slide with key statistic hook
Executive summary slide (3 bullet points)
One slide per disaster type (floods, droughts, storms, wildfires) with regional impact
Economic impact slide with cost breakdown
Resource allocation recommendations slide
Citations
The flow was logical. The key ideas were highlighted. The design was clean. The talking points were perfectly sized, not too much text, not too little context.
That deck took me 10 minutes. The deck I would have built manually would have taken me all Sunday afternoon, and I would have resented every minute of it 😂.
What I didn’t have to do:
Decide on slide structure
Format text and images
Create visual hierarchy
Design layout
Find appropriate graphics
Build transition flow
For professional learning specifically, this is transformative. If you’re creating training materials, onboarding presentations, or educational content, you can now turn any research into structured learning slides without PowerPoint expertise.
4. AUDIO: Interact with your Podcast
I had my research report. I had my infographics. I had my presentation. But I learn best when I can listen while walking, driving, or at the gym.
NotebookLM’s Audio Overview feature converts your research into a realistic AI-generated podcast with two conversational hosts discussing your content.
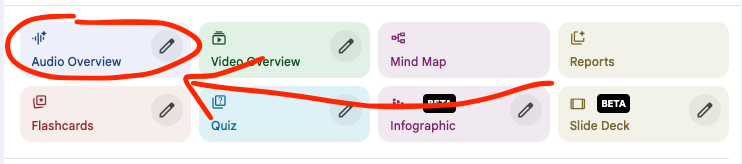
I selected my Deep Research report and clicked “Generate Audio Overview.”
Then I customized:
Format: Deep Dive (comprehensive discussion)
Focus: Explain why 2025 saw such dramatic increases and what this means for humanitarian response planning” Level: “Assume the listener understands basic disaster response but needs context on 2025-specific factors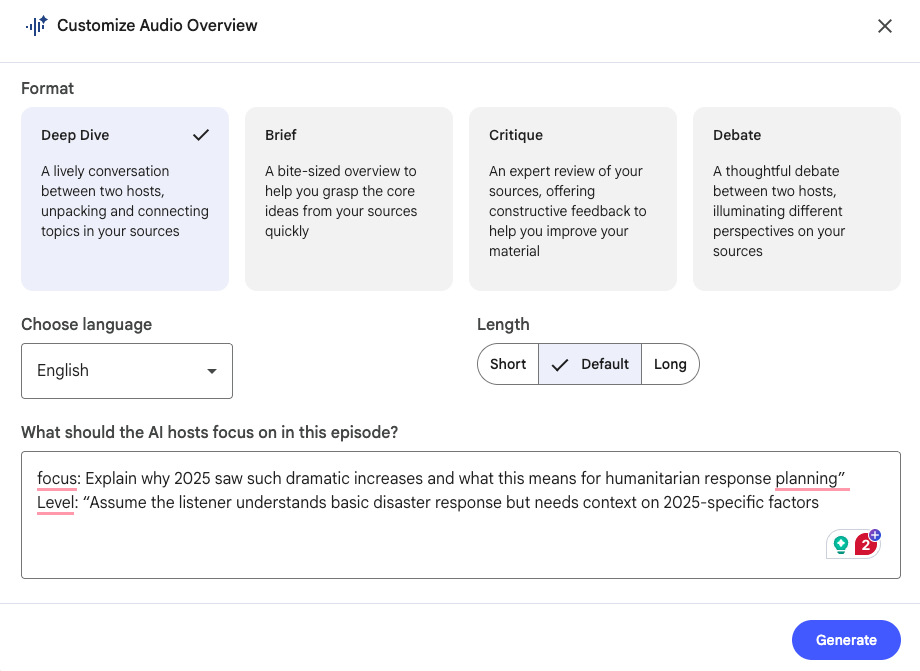
What NotebookLM created was a full podcast where two hosts discussed:
Climate pattern shifts in 2025 (El Niño effects)
Infrastructure vulnerabilities in affected regions
Why East Africa was particularly impacted
What the data suggests for 2026 planning
Resource allocation implications
BUT…
The game-changing feature: Interactive Mode.
While listening, I could interrupt the podcast with a question. I typed: “What is the biggest risk going into 2026?”
Here’s a glimpse where I interrupted twice…👇 (AUDIO NEEDED)
The hosts stopped and answered my specific question using the sources 🤯.
This transformed passive listening into active learning.
This isn’t adding to the noise. It’s turning the research you already need into a format that fits your life instead of demanding dedicated desk time.
I didn’t find more time to learn. I found time that was already there but wasted.
5. SYSTEM: How I Actually Use These Together
Let me show you how I use these features together. It’s not a perfect system, but it works.
First, I run Deep Research with specific source constraints. Takes about 15 minutes to get comprehensive results.
Then I look at what I got and decide what format I need next. Presenting to stakeholders? Generate slides. Sharing on social? Create an infographic. Learning while walking? Audio overview.
Sometimes I do all three. Sometimes just one. Depends what I’m trying to accomplish.
For the natural disaster research:
Deep Research gave me verified data
Infographic turned statistics into a scannable visual
Slide deck prepared me for presentations
The audio overview helped me internalize the information during my commute
For Cozora launch:
Deep Research covered the competitive landscape, market sizing, and user research
Audio overviews let me review everything while walking
All sources remained in my notebook. I could ask follow-up questions anytime. Generate additional content as needs emerged.
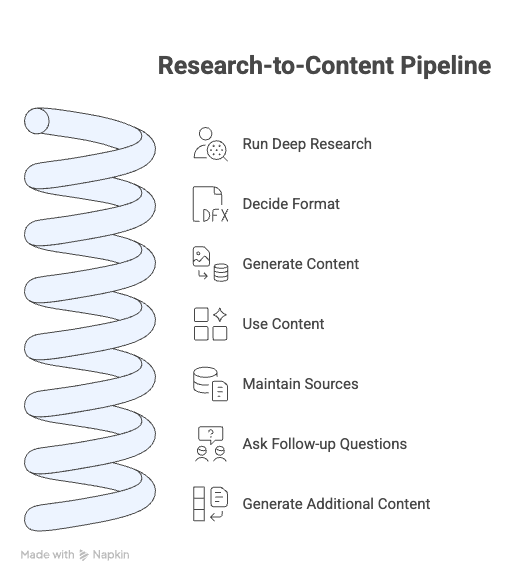
This isn’t just research. This is a research-to-content pipeline that scales infinitely.
Now.. It’s your turn
If You Only Remember This
Source control eliminates guesswork: You define which sources the AI uses, guaranteeing research credibility instead of hoping for it.
Infographics remove the design barrier: Professional visual content without Canva, without designers, without the learning curve that stops most leaders from creating visual materials.
Slide decks compress hours into minutes: Presentation creation becomes about reviewing and tweaking, not building from scratch.
Audio overviews unlock dead time: Your commute becomes learning time. Your walk becomes research time. Time that was wasted becomes productive.
“The research you skip because you don’t have time creates the decisions you regret because you didn’t have information.”
Join Premium Today - Let’s chat 1 on 1
If you found this useful, subscribe to Leadership in Change. I share the complete breakdowns, the exact systems, the mistakes I made, and what actually works at the intersection of leadership and AI.
PS: Many subscribers get their Premium membership reimbursed through their company’s professional development $. Use this template to request yours.
Let’s Connect
I love connecting with people. Please use the following connect, collaborate, if you have an idea, or just want to engage further:
LinkedIn / Community Chat / Email / Medium
My favourite thing about Notebook LM is how it makes thorough research possible within real time constraints. Thanks for putting this together!
Joel with the banger of an article over here! I love using NotebookLM, and thank you for writing this!